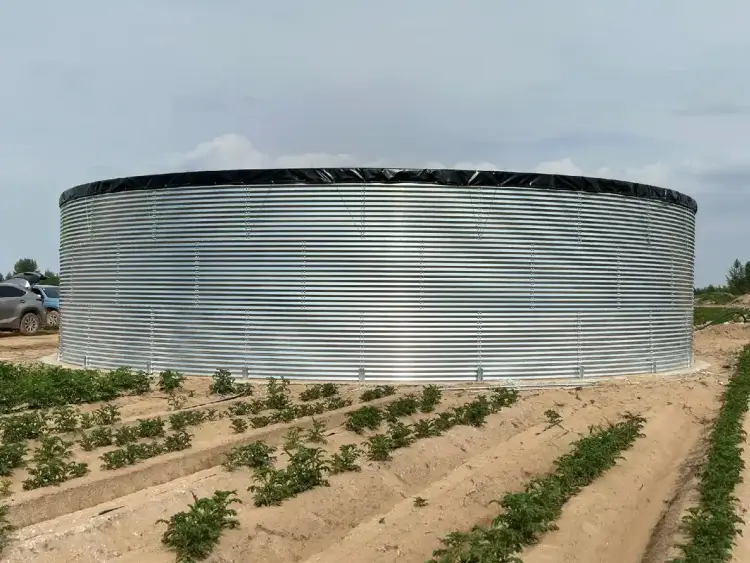
Water storage capacity planning remains a critical challenge in modern agricultural operations, particularly when implementing corrugated steel water storage tanks. This engineering guide provides a systematic approach to determining optimal tank capacity by integrating hydrologic modeling, structural engineering principles, and agronomic requirements. Focusing specifically on corrugated steel water storage tanks – the most durable and cost-effective solution for 82% of commercial farms according to USDA 2024 data – our methodology addresses three key challenges:
Part 1: Agricultural Water Demand Characterization
Crop-Specific Water Requirements
- Crop coefficients (Kc): Wheat (0.3-1.15), Tea (0.7-1.1), Greenhouse crops (0.5-1.3) based on growth stages
- Irrigation methods: Drip (85% efficiency), Sprinkler (75%), Flood (60%) per USDA NRCS standards
- Climate zoning: Arid (ET₀ >7mm/day), Semi-arid (5-7mm/day), Humid (<5mm/day)
Peak Demand Calculation
Using FAO56 Penman-Monteith: ETcrop = Kc × ET₀ Where ET₀ (Reference Evapotranspiration) = [0.408Δ(Rₙ-G)+γ(900/(T+273))u₂(eₛ-eₐ)]/[Δ+γ(1+0.34u₂)]
Part 2: Five-Step Capacity Calculation Methodology
Step 1: Structural Capacity Modeling
ASTM A36 steel properties:
- Yield strength: 250 MPa
- Allowable stress: 0.6×Fy = 150 MPa
- Buckling resistance: Pcr = (π²EI)/(KL)²
Step 2: Safety Factor Determination
Drought index correlation: SF = 1 + (0.15 × DI) Where DI = (P-PET)/PET × 100%
Step 3: Evaporation Compensation
Daily loss = ET₀ × SurfaceArea × 0.7 (70% reduction factor for tank)
Step 4: Cost-Capacity Optimization
NPV = Σ[(InitialCost + Maintenance)/(1+r)ⁿ] Where r = discount rate (typically 5-8%)
Step 5: Water Quality Maintenance
Microbial growth model: log(Nt) = log(N₀) + μt Where μ = 0.03-0.15/day for stagnant water
Part 3: Field Validation Cases
Case 1: Wheat Farm (North China Plain)
- Parameters: 50ha, DI=25%, Kc=1.15
- Calculated capacity: 2,850m³ ±12%
- Actual performance: 3,100m³ used during 2024 drought
Case 2: Tea Plantation (Fujian Hills)
- Parameters: 30° slope, ET₀=5.2mm/day
- Special design: Cascaded tanks with 15% elevation compensation
- Result: 18% water saving vs single-tank design
Case 3: Desert Greenhouse (Negev)
- Challenge: 9.1mm/day ET₀
- Solution: 5mm insulated steel with 2.5m³/m² capacity
- ROI: 4.2 years with solar desalination integration
Technical Visualizations
- Crop Water Demand Curve (Fig.1)
- Cost-Lifetime Scatter Plot (Fig.2)
- Decision Flowchart (Fig.3)
- 3D Cost-Surface Model (Fig.4)
- TDS-Time Correlation (Fig.5)